
Shareable reports
Turn a date range into something you can hand to a label, a manager or a client.
Pro and above
What you get#
A report is a clean page covering the dates you choose, carrying your own name and logo rather than ours. You get a link you can send and a PDF you can attach. Both show the same figures.
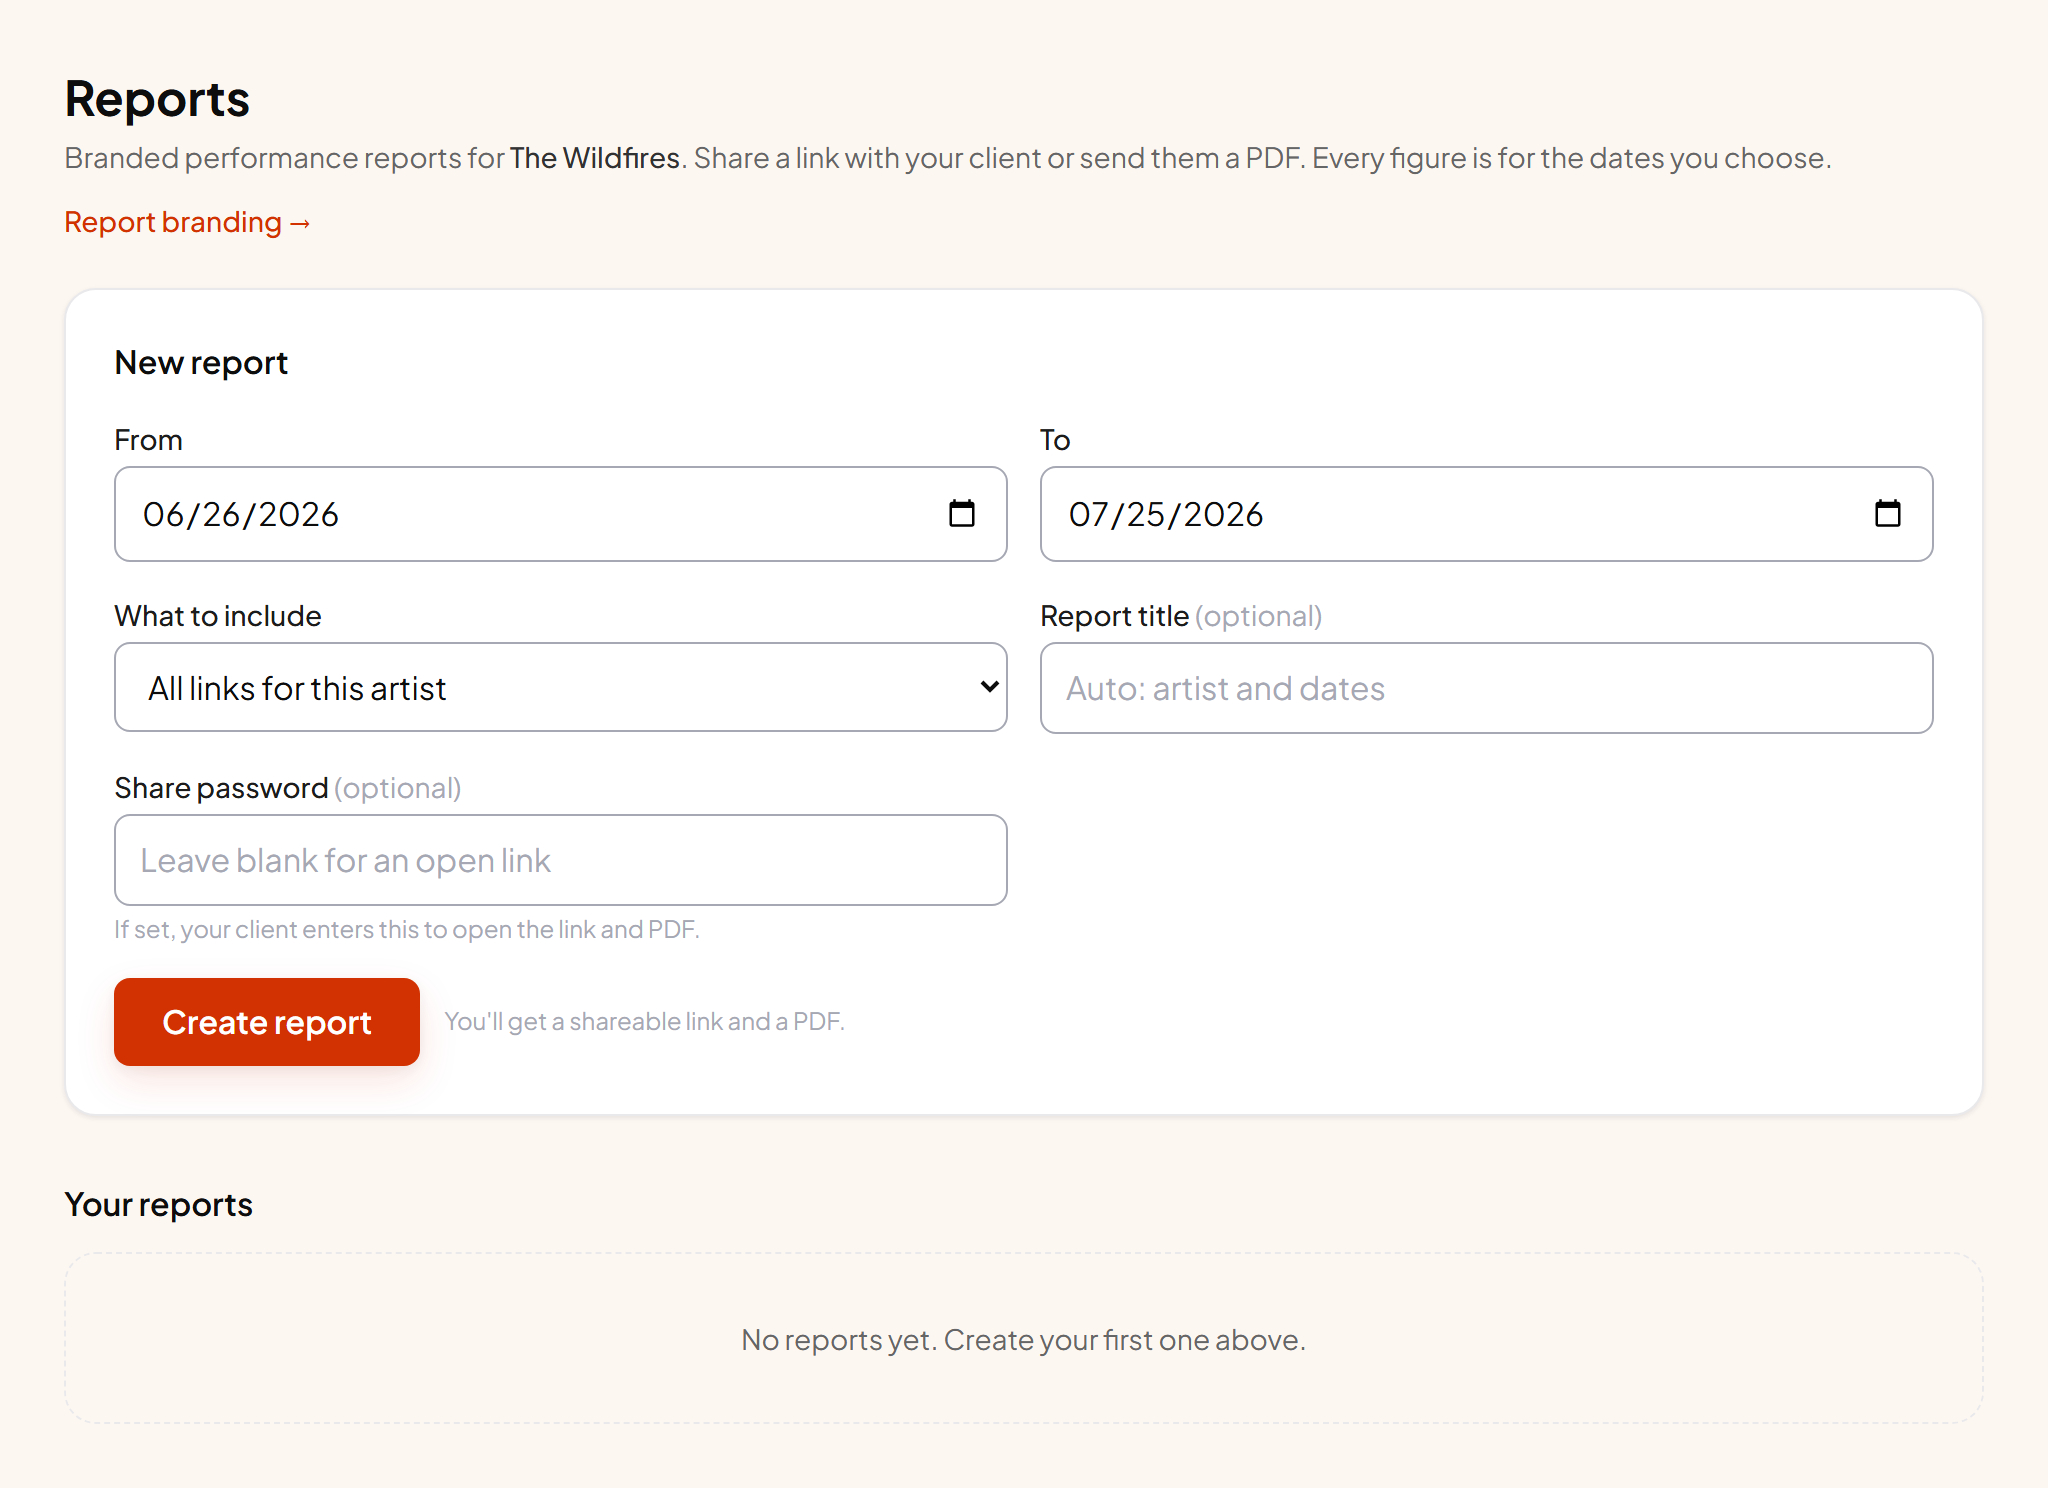
Making one#
- 1 Pick the dates Use the campaign's real start and end, not a rounded month. Every number in the report is calculated for exactly that window.
- 2 Name it Something the recipient will recognise, like "Golden Hour launch, March".
- 3 Add a password if it isn't for public eyes Optional. With one set, both the link and the PDF ask for it before opening.
- 4 Create You get a share link and a PDF download straight away.
Your name on it, not ours#
Set your agency or label name and logo once on Account and every report picks them up. This is the difference between sending a client a screenshot of someone else's tool and sending them your own reporting.
When to use a report instead of the CSV#
Send a report when someone needs to read and understand the numbers. Send the CSV when someone needs to do their own maths in a spreadsheet. The CSV is a row per day; the report is the interpreted version with the breakdowns laid out.